Using story charts in the classroom
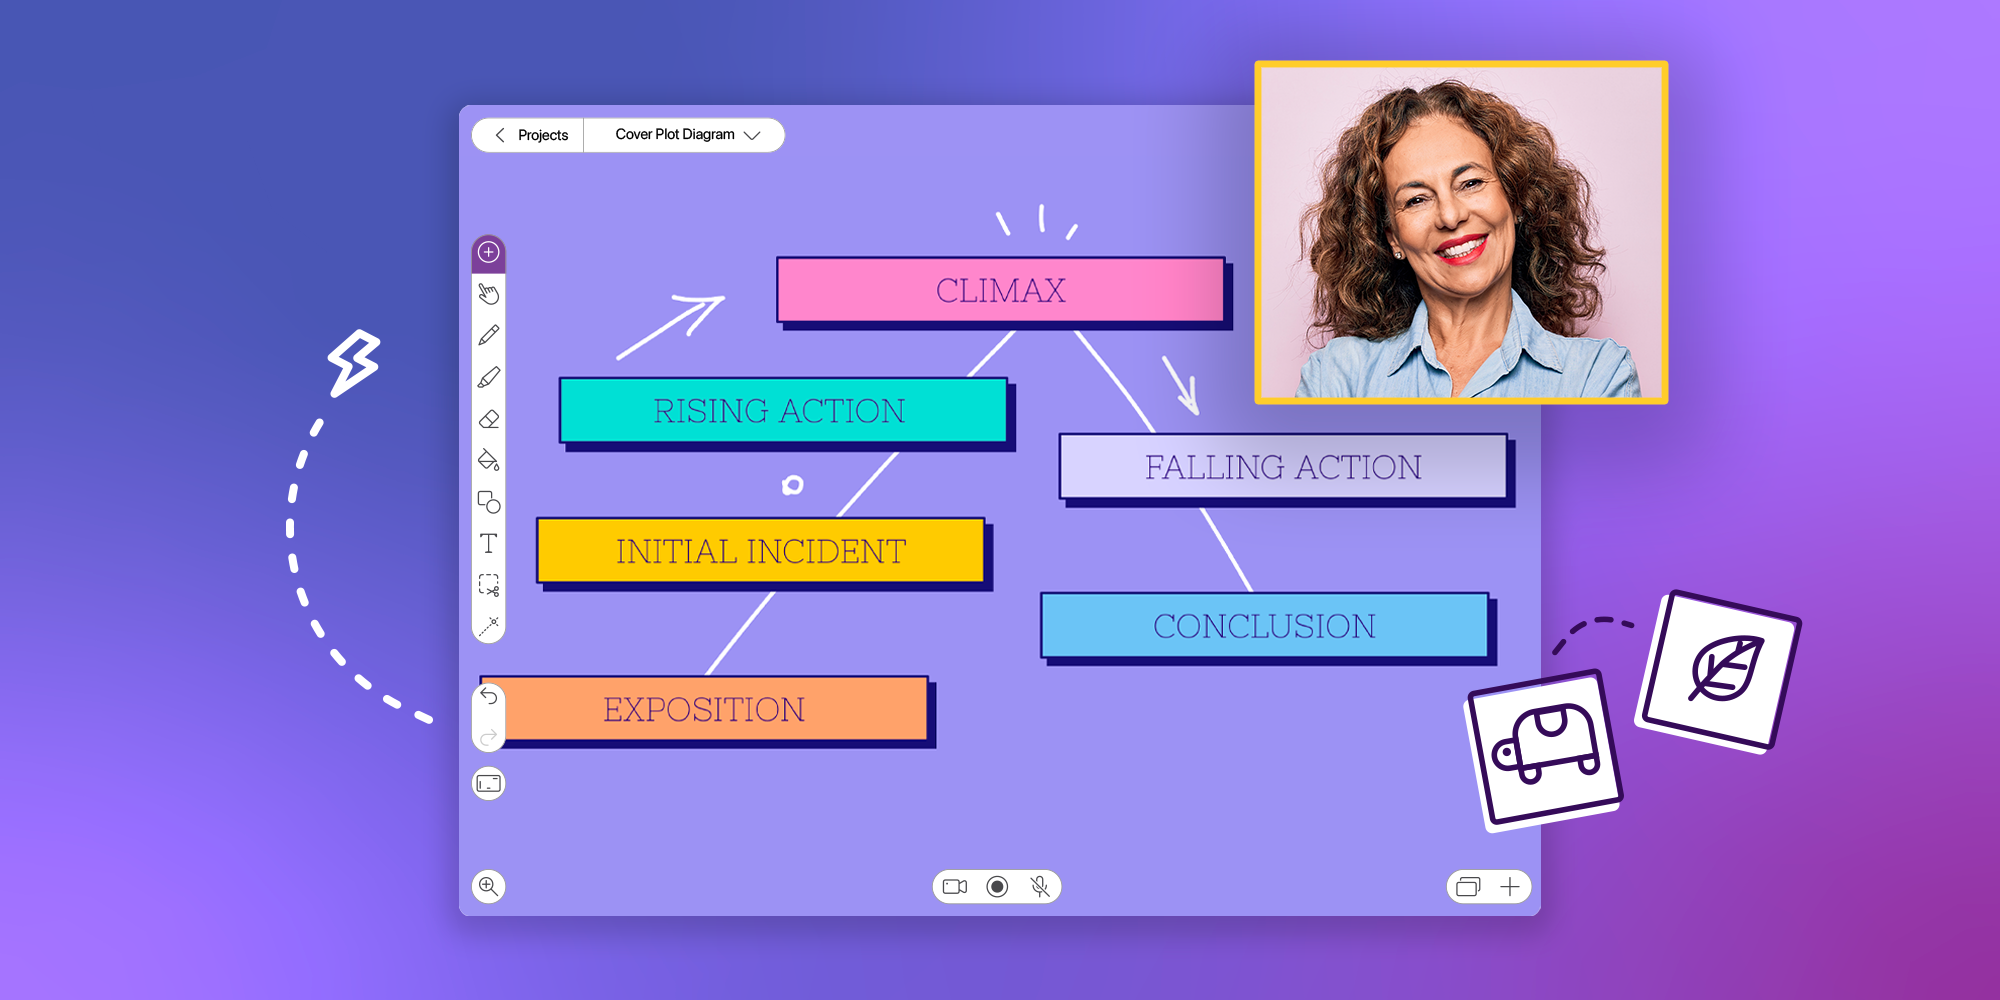
Table of Contents
How to use story charts in the classroom
Teaching children how to write stories? A big part of this involves teaching children how to plan them.
To pace a good story, writers usually rely on lots of advanced planning. Very few authors will put pen to paper (or hands to keyboard) without creating a plan first. That’s why it’s crucial to introduce planning to budding young writers. Story charts are a great visual way of teaching children how to structure their stories before they start writing.
There are different ways of approaching story charts, with the most common formats focusing on story structure and elements. Read on to find out about the most common types of story diagrams and how the Explain Everything online whiteboard can help children use them.
Plot diagrams
What is a plot diagram?
A plot diagram is a graphical representation of a story’s sequence of events. It can also be called a story diagram, story chart, plot mountain anchor chart, or plot structure anchor chart.
Whatever you call it, it’s a diagram that represents the structure of a story with a line that rises and falls. This looks like a triangle without a base and two horizontal lines on each side. This line drawing can also look like a mountain (which is why some people call this a plot mountain). Once you’ve drawn the outer shape, you can map different stages of a plot structure along the lines.
The most common plot structure that you’ll see in conventional stories and school teaching materials is Freytag’s Pyramid. Designed by German playwright Gustav Freytag, this plot model follows a story that rises, peaks and falls.
Freytag’s Pyramid has six stages:
- Exposition – The scene setting stage where the writer introduces the characters and the location.
- Inciting incident – An event that will lead to conflict that’s key to plot development. Examples include a letter arriving, a discovery being made, or a character being told certain information.
- Rising action – The part that (usually) takes up most of a story. The rising action stage involves a build-up to the main plot point. There can also be subplots and more character development included here, too.
- Climax – The most dramatic part. The story’s central conflict should be resolved during the climax. It’s not the end yet, but this part is where the tension peaks.
- Falling action – Where characters and their world(s) adjust after whatever has happened in the climax.
- Resolution – Also called the denouement, the resolution is where the author ties up the story and any loose ends.
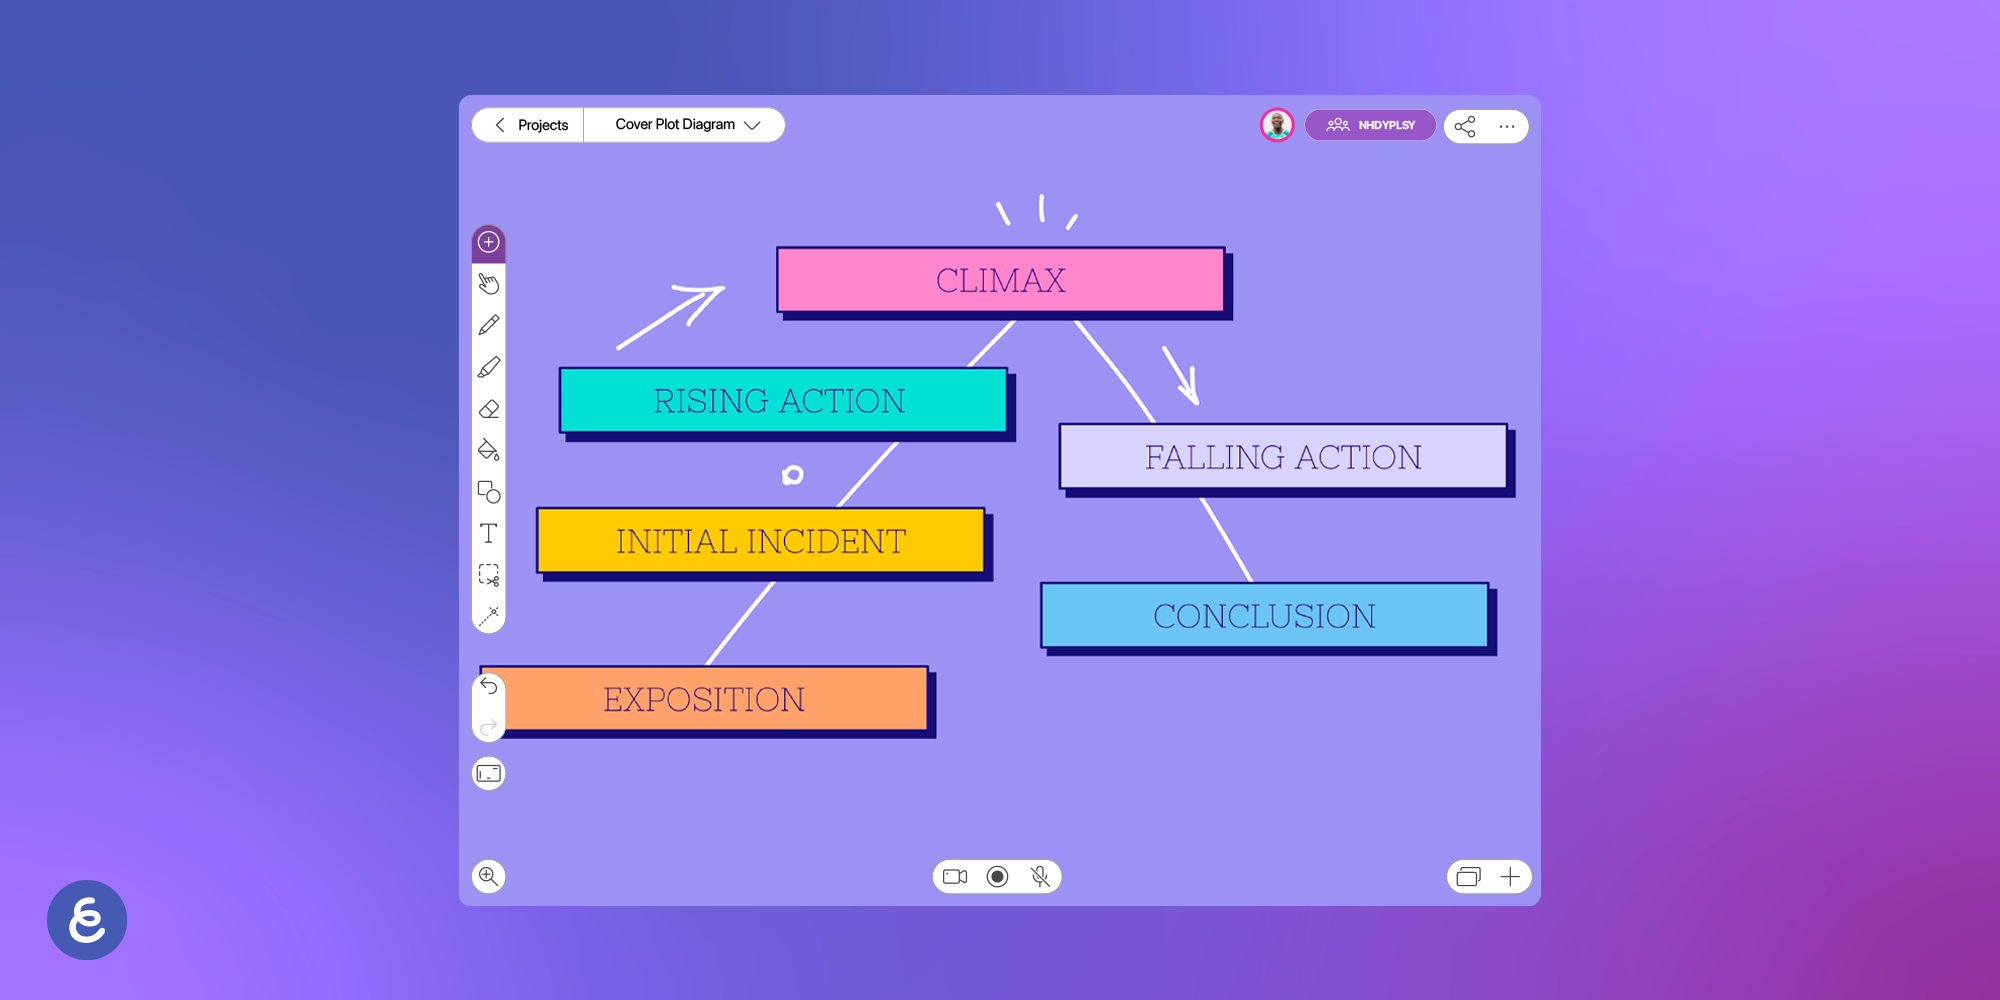
Story planners can map these stages against a plot diagram, with the exposition and inciting incident at the beginning, rising action on an upward diagonal line, the climax at the top of the triangle, falling action going down the other side, and the resolution on a flat end. Plotting a story in this way can help budding storytellers visualize how drama builds and falls across the narrative.
To build their own story, would-be writers need to label each part of the diagram with their story elements. What happens in the rising action? What’s the climax? How does the story end?
Build your own plot diagram template
Building a plot diagram template with Explain Everything’s online whiteboard software is easy.
To do so:
- Register for your free Explain Everything account
- Start a new project (you can create three projects for free)
- Open a blank canvas
- Select the Draw Tool to draw the plot diagram
- Label the story points (e.g. exposition, climax, falling action) using the Text Tool
- Use Shapes to add boxes alongside each element
- If needed, use the Draw Tool to draw any lines to make it clear which boxes connect to each element
Top tip: if you’re using Explain Everything on iOS or Android, you can select the Ruler to draw straight lines.
You can keep your template simple or use imported images, Clipart, and bright colors to make it more fun. For example, you can add an image of a rollercoaster cart at the diagram’s peak to help children visualize the rise and fall of a story. With a premium Clipart library included for free in Explain Everything, there’s plenty of readymade images to choose from.
You can also play around with how you label the diagram. When teachers use plot diagrams in schools, they may want to vary how much of Freytag’s Pyramid they use. This will depend on the ages and abilities of their pupils. For instance, the “inciting incident” element is sometimes left out of simpler plot diagrams. Teachers may also want to use more straightforward names to describe the different parts. So, some plot diagrams will say “Beginning” instead of “Exposition” or “Ending” instead of “Resolution” or “Denouement”.
Once you’re happy with your template, you can roll it out for your pupils. Print the template, and children can fill it out with pens. For group activities, teachers can also pull up the template on their interactive display, like a Promethean ActivPanel. By displaying the template on a large display, teachers can invite their students to come up to interact with the panel and either write or type information into the boxes. It’s a great way to get the whole class involved.
Alternatively, export your template as a PDF file, PNG image, or Explain Everything project. Your pupils can then open this up on their devices. If they have their own Explain Everything accounts, they’ll be able to use the same whiteboard tools to annotate their plot diagrams.
How to use plot diagram templates in your classroom
Using plot diagrams in your lessons is a great way of getting students to think about story structure. With templates, pupils can fill in individual plot diagrams that encourage creative thinking.
One way of teaching story planning is to help your pupils create plot charts for short stories that they’ll then write.
To help your students, assign a loose theme (such as “magical” or “historical”) or a plot point (such as the inciting incident being the arrival of a stranger). These pointers can offer the inspiration students need to get started. If you’re using a Promethean interactive display or you’ve downloaded Promethean’s Spinner App onto another device, your pupils can use a Spinner to randomly select story elements. Pupils may find it overwhelming to come up with a story out of nowhere, but prompts like these will help spark creativity.
Once your students know what kind of story they want to write, ask them to map out key points using your plot diagram template. It’s a good idea to set aside time for this activity. You want to teach students the value of planning and stop them from racing ahead and writing immediately.
Once children have planned out their stories, you may want to take these away for marking. This way you can see whether your pupils have understood the fundamentals of using a story chart.
Once you’re happy with the plot diagrams, ask students to write the short stories they’ve planned. This teaches children how to put their plans into action. Some things may change while writing, but it’s good practice for pupils to see how structured plans come to life.
To keep including plot diagrams in your lessons, try different activities such as:
- Asking students to write out the plot of an existing story (such as a book on the English curriculum) using the plot diagram structure
- Encouraging students to color code each other’s short stories using highlighters, with each color corresponding to a different part of a plot diagram (i.e. rising action, climax, falling action)
- Instruct pupils to draw an illustration that represents each stage of the plot – helping pupils to visualize plot structure
Story structure anchor charts
What is a story structure anchor chart?
A story structure anchor chart is another way of plotting out a story in a visual way.
Unlike a plot diagram, an anchor chart for story structure does not have to be as prescriptive. It can come in different forms to the triangle shape. It also goes beyond the order of plot events and gives more consideration to the overarching story elements of settings and characters.
In general, a story structure chart will show the following things:
- Characters – What people, animals, or other characters will be in the story? What are their personalities? How are the characters’ appearances described?
- Setting – Where does this story take place? When is the story set? What does the setting look like, and does this match the atmosphere?
- Beginning – Think of this as a simplified way of rolling Freytag’s exposition and inciting incident into one. How does the story start? What happens as the story starts to build?
- Middle – This is where Freytag’s method would put the rising action and climax parts of a story. What happens for most of the story? What big event happens at its peak?
- End – How does the story wrap up?
Many story charts will also allow you to write about the problem and solution stages. The problem is the plot driver that happens as the action builds, while the solution is how this problem is solved, which leads to the story’s conclusion.
Story structure anchor charts can be visualized like a plot diagram with a rise and fall, e.g. an open-ended triangle or a rollercoaster with labels. As there are other elements to consider beyond plot order, some people prefer to use grids or tables. You can get creative with what’ll work best for you and your pupils.
Build your own story structure anchor chart template
As a story structure anchor chart is more flexible than a plot diagram, you can build one exactly how you like using Explain Everything.
One way you can make a story structure anchor chart is:
- Register for your free Explain Everything account
- Start a new project
- Open a blank canvas
- Use the Shapes tool to outline the chart you want to make
- Use the Draw Tool to outline the curve of a plot if you want to visualize this, like a simple plot diagram alternative
- Add any annotations with the Text Tool; you can change color to add additional questions to make it easier for children to understand
- If desired, use Clipart or imported images to help children understand what each box refers to. However, you don’t want to overcrowd things, so leave room for your pupils to add their drawings or writing.
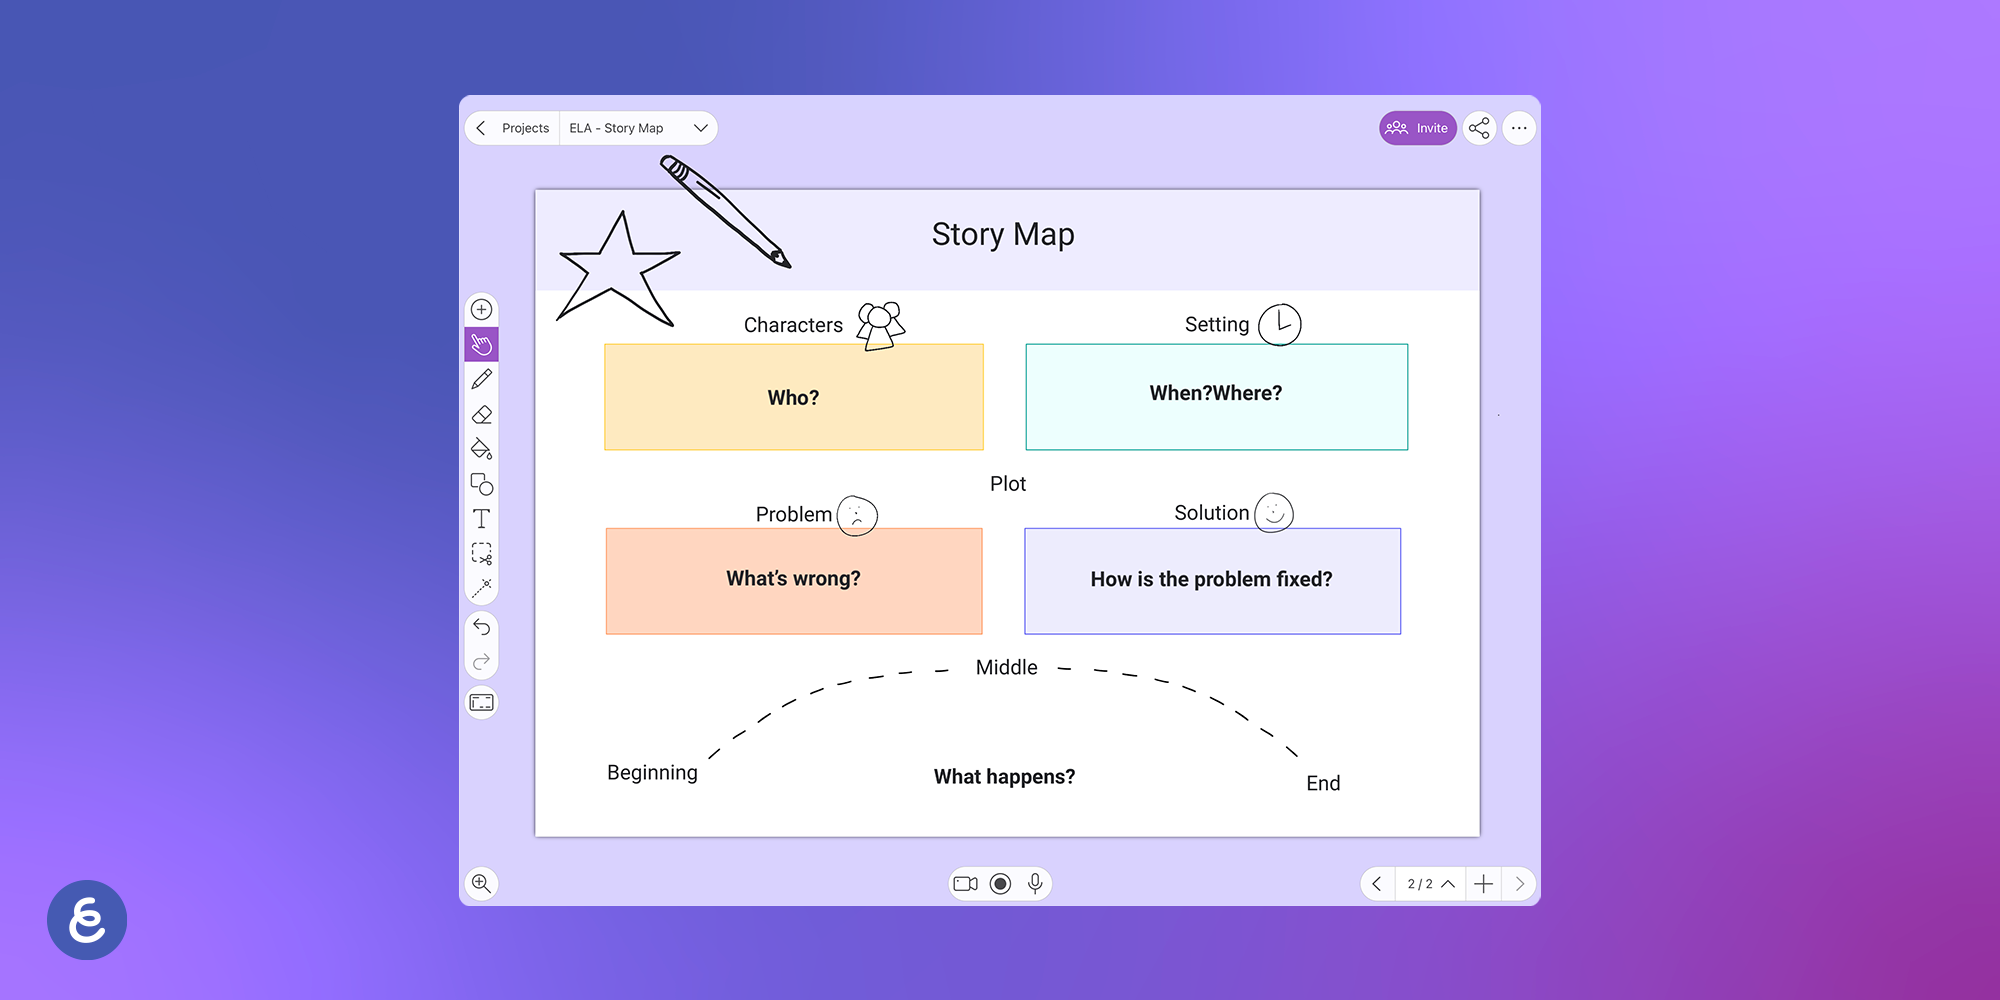
Looking for a story chart example? We suggest having a box for ‘Characters’, another for ‘Setting’, and a larger one for ‘Plot’. Within the ‘Plot’ part, you can also leave space to add in the ‘Problem’ and ‘Solution’. This is just one way of creating a chart, though, so feel free to be flexible with your template.
How to use story structure templates in your classroom
You can use story structure templates in your classroom to help your pupils examine the structure of existing stories and to inform how they plan their own.
When using a story structure chart to teach how different elements impact a story, start by analyzing other texts. Students can read a short story or watch a short film together and then fill in this template. To speed up the lesson, teachers can pick a story most will already know or can be quickly summarized, like Cinderella. Approaching story structures using familiar tales helps children learn how story elements work.
Learning story structures by analyzing existing text can be a group activity. When teachers upload projects into the Explain Everything Whiteboard on ActivPanel 9, or use another interactive display to share an Explain Everything project from another device, they can pull up their story structure template for their pupils to see. Teachers can then annotate using their fingers or pens, or invite their students to do the same. Teachers can also use other ready-made free Explain Everything templates, such as the Author’s purpose example, to encourage their classrooms to analyze texts.
Of course, pupils can also use the story structure anchor chart template to help them write their own stories. Just like with the plot diagram template, you can print the story anchor chart template or download it onto other devices. Children can use this template repeatedly whenever they want to write a story. It can be part of the wider creative writing process or a standalone task to help children learn more about story structure.
Making story charts with Explain Everything
Explain Everything makes it easy for teachers to build plot diagrams and story charts — and simple for children to get involved and start planning their imaginative stories.
To start making templates, sign up for your free Explain Everything account today. Want access to more features and the ability to create unlimited custom templates? Upgrade to Explain Everything Advanced.
Recommended articles:
- How to use affinity diagrams to empower students
- How to use technology in the classroom to benefit students
- Teaching reading and writing with a smartboard