Five diagrams that are key to visual learning in e-learning
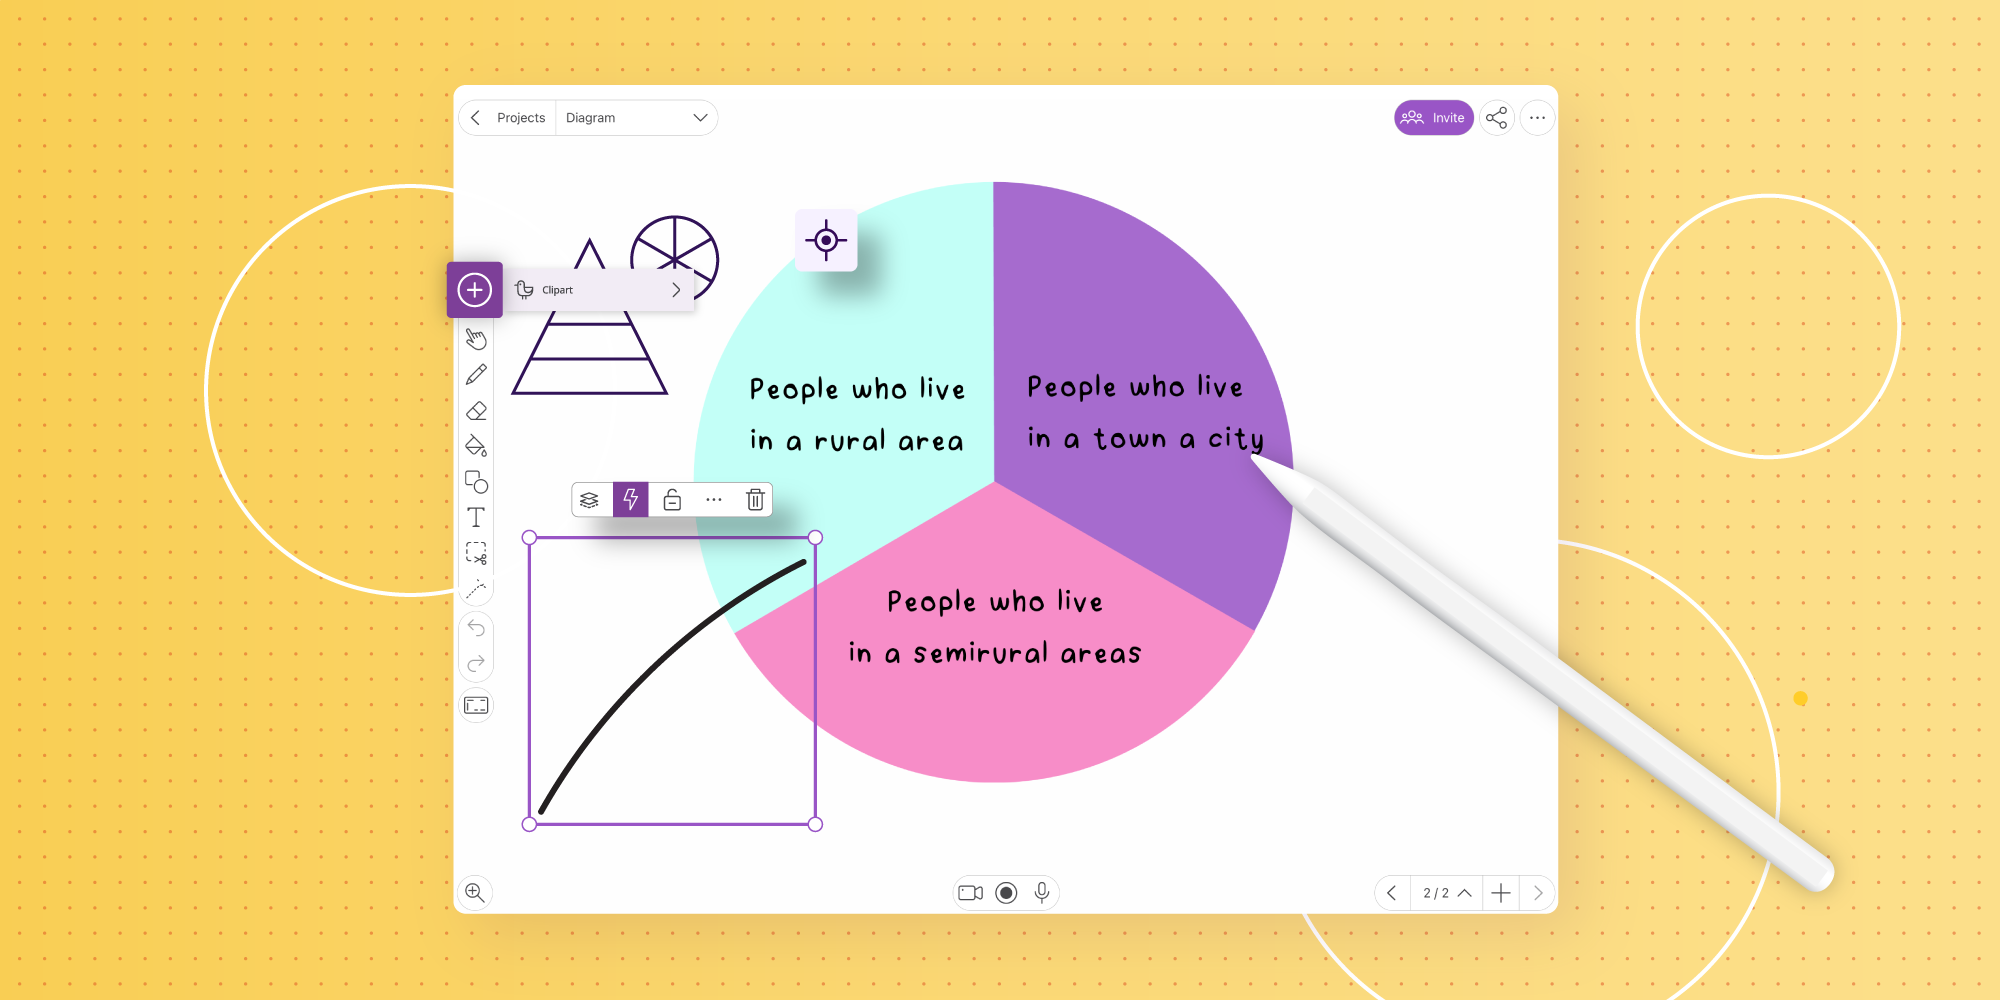
Table of Contents
How to use visual learning in the classroom
Visual learning refers to students absorbing information from things they see, such as images, graphics, maps, and diagrams. Thanks to the rise of e-learning tools, it’s easier than ever for teachers to incorporate visual learning into their lesson plans — helping students who learn best with visual references.
In this guide, we’ll explore what visual e-learning tools are, how to use them, and their benefits. Plus, we’ll share five types of learning diagrams and how you can create them.
What are visual e-learning tools?
Visual e-learning tools are the technology that helps teachers bring digital images into their classrooms. Breaking this down further: e-learning is the use of electronic devices and software in education, while the visuals are infographics, videos, charts, animations, and more. Visual e-learning brings these two things together: education technology and images.
Thanks to e-learning tools like Explain Everything’s online whiteboard, educators can effectively teach using digitized visuals. For example, teachers can introduce their class to phonics by building sound mats using Clipart or simplifying information with sketchnoting. With this, having a picture helps children make the connections between a written word (i.e., the letters ‘c-a-t’), what that represents (i.e., the animal), and how it sounds (i.e., how you say ‘cat’).
Are there other visual e-learning tools than whiteboards?
Online whiteboards on interactive displays (like Promethean’s ActivPanel 9) and compute devices (like an OPS-A) are the most commonly used e-learning tools. These are powerful on their own, but there are other ways to include even more visual learning in your lessons.
Immersive technology such as augmented reality (AR), virtual reality (VR), and simulations are newer visual e-learning tools. After all, what could help students imagine what it was like to live in Ancient Egypt better than to see it through their own eyes via a VR headset?
Interactive learning platforms also involve visual learning — particularly those that embrace gamification in education. For example, if you’re testing your students’ knowledge of algebra, you could give them equations on a test paper. However, e-learning software opens the possibility for interactive visual elements. For instance, pupils can learn algebra via games on their tablets that include visual micro-interactions, such as confetti cannons, to celebrate getting an answer right. With more schools providing children with digital devices, like tablets, interactive learning can become part of regular lessons.
While AR and VR will be too expensive for many schools and pre-programmed learning platforms do not exist for every subject, teachers can — and should — embrace visual e-learning tools in their day-to-day lessons. For instance, creating diagrams with an online whiteboard is a simple way of visualizing subject matter, and this technology will be accessible to many teachers. We’ll run through the diagrams teachers can use to embrace visual learning.
Five types of diagrams for visual learning — examples
Teachers can use many different types of visual diagrams in their lessons.
Diagrams help pupils understand even the trickiest of topics. It’s hard for students to digest every piece of information, but visuals can make it easier.
These diagram examples are a straightforward way of bringing visual e-learning into your classroom:
Flow charts
A flow chart, also known as a process map, is a diagram that outlines the steps of a process from beginning to end. They will typically include process boxes (detailing what happens at each stage), flow lines and arrows (connecting the stages and sometimes going in multiple directions if there are several possible routes), and other visual symbols (such as Clipart to depict the process).
In the classroom, teachers can use flow charts to educate students about things like:
- How recycling works
- How to identify emotions
- How honey is made
Sometimes, flow charts take the form of quizzes, like those you’ll see in magazines. Teachers can use this style to help their pupils identify patterns. For example, pupils can use a flow chart to help them identify different word groups, such as nouns, adjectives, and verbs, by answering questions about the word and following the journey.
How to make a flow chart using Explain Everything
To use Explain Everything’s online whiteboard to create a flow chart:
- Sign in to your account or sign up for free
- Open the whiteboard
- Create a New Project with a Blank Canvas
- Use the Text Tool to write out any process boxes (you can use the Shapes tool if you want box outlines here)
- Select Add Media and import visuals from Clipart, GIPHY, or Unsplash (via Image/GIF from the Web), or your own Existing Image/Video
- Use the Draw Tool to create flow lines and arrows
Example flow chart
Pie charts
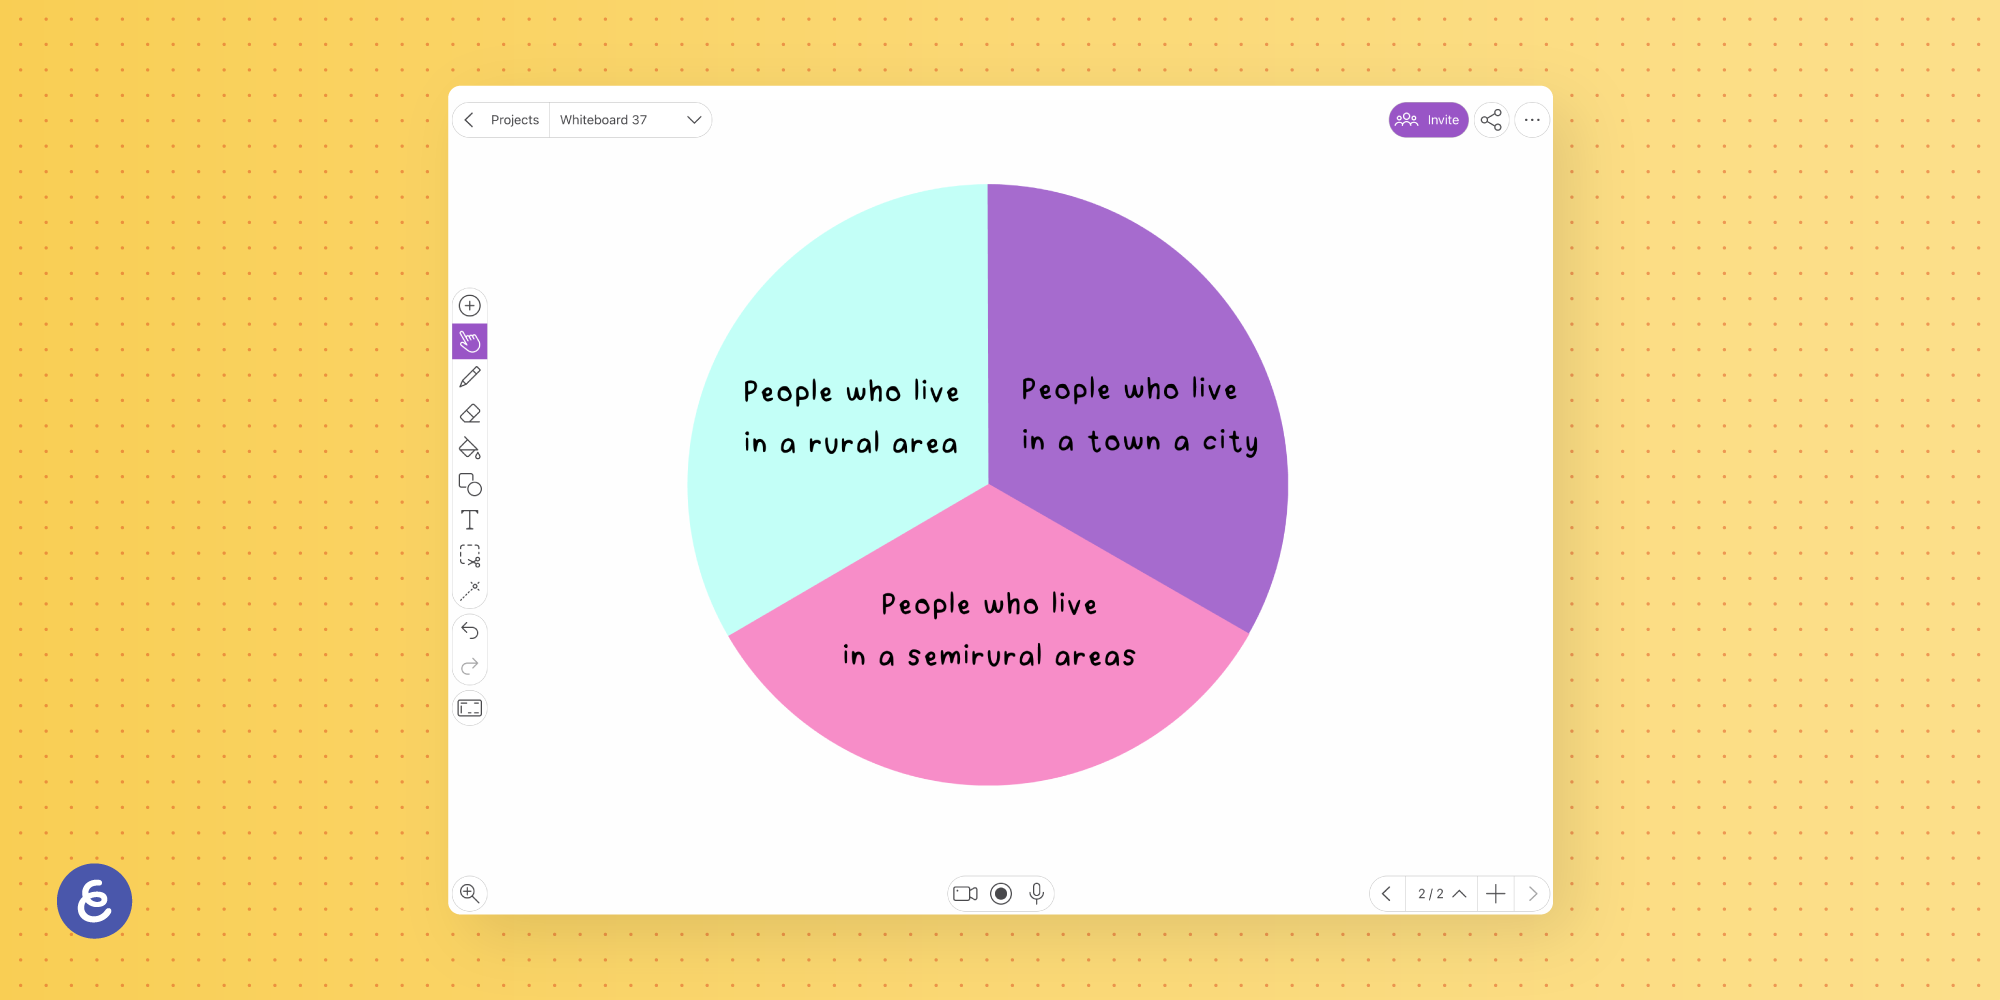
A pie chart is a circular chart that’s divided into segments to represent percentages.
Of course, pie charts have their place as part of math lessons. Teaching children how to make pie charts is usually on the curriculum. However, educators can also use them to help pupils absorb other information.
So, when teachers are explaining percentages in relation to something else (i.e., how many people live in rural, semi-rural, and built-up areas), they can communicate this information visually with a pie chart.
How to make a pie chart using Explain Everything
Whether you’re using a pie chart as part of a traditional math lesson or to visualize other information, it’s easy to make one with Explain Everything.
Simply:
- Access your free Explain Everything account
- Launch the whiteboard
- Start a New Project with a Blank Canvas
- Click Add on the toolbar to insert Media
- Select Clipart
- Look for the Math category and pick a pre-made blank pie chart
- If there isn’t a pie chart divided into the amount of segments you’re looking for, use the Draw Tool to divide the circle (top tip: use the Ruler for straight lines)
- Use the Fill tool to color each section
- Annotate the diagram with the Text Tool
This method works for pie charts based on crude percentages (such as split into thirds). But if you want something more complicated or mathematically accurate, try creating your pie chart in other software, such as Excel. Once you’ve done this, you can export the pie chart as an image and add it to Explain Everything.
Example pie chart
Bar graphs
Bar charts or bar graphs are a simple way of visualizing information. Again, teachers can use them to teach statistics from other subjects beyond math.
For example, educators can create bar graphs to show:
- How population has changed over time
- The different types of transport children use to get to school
- The favorite colors of those in the classroom
Bar charts can either be horizontal or vertical.
How to make a bar graph using Explain Everything
To create a bar chart with Explain Everything:
- Make sure you’re signed into Explain Everything
- Access the whiteboard
- Set up a New Project with a Blank Canvas
- Click Shapes and select the line shape
- Touch and drag to create a long horizontal line
- Tap the Inspector and Duplicate to create a copy of this line
- Use the hand tool to make this line vertical and drag it into place
- Create more lines to make a scale for the chart
- Annotate the X and Y axes using the Text Tool
- To create the bars, tap Shapes, select the square and rectangle option, and drag the bar into place
- Use the Inspector to duplicate the bar as many times as you need and move these into place
- Drag the top of each bar higher or lower to adjust their height (and where they fall on the chart)
- Use Bucket Fill to change the color of any columns
For more tips on keeping this neat, visit our advice for quickly adjusting inserted shapes.
Example bar graph

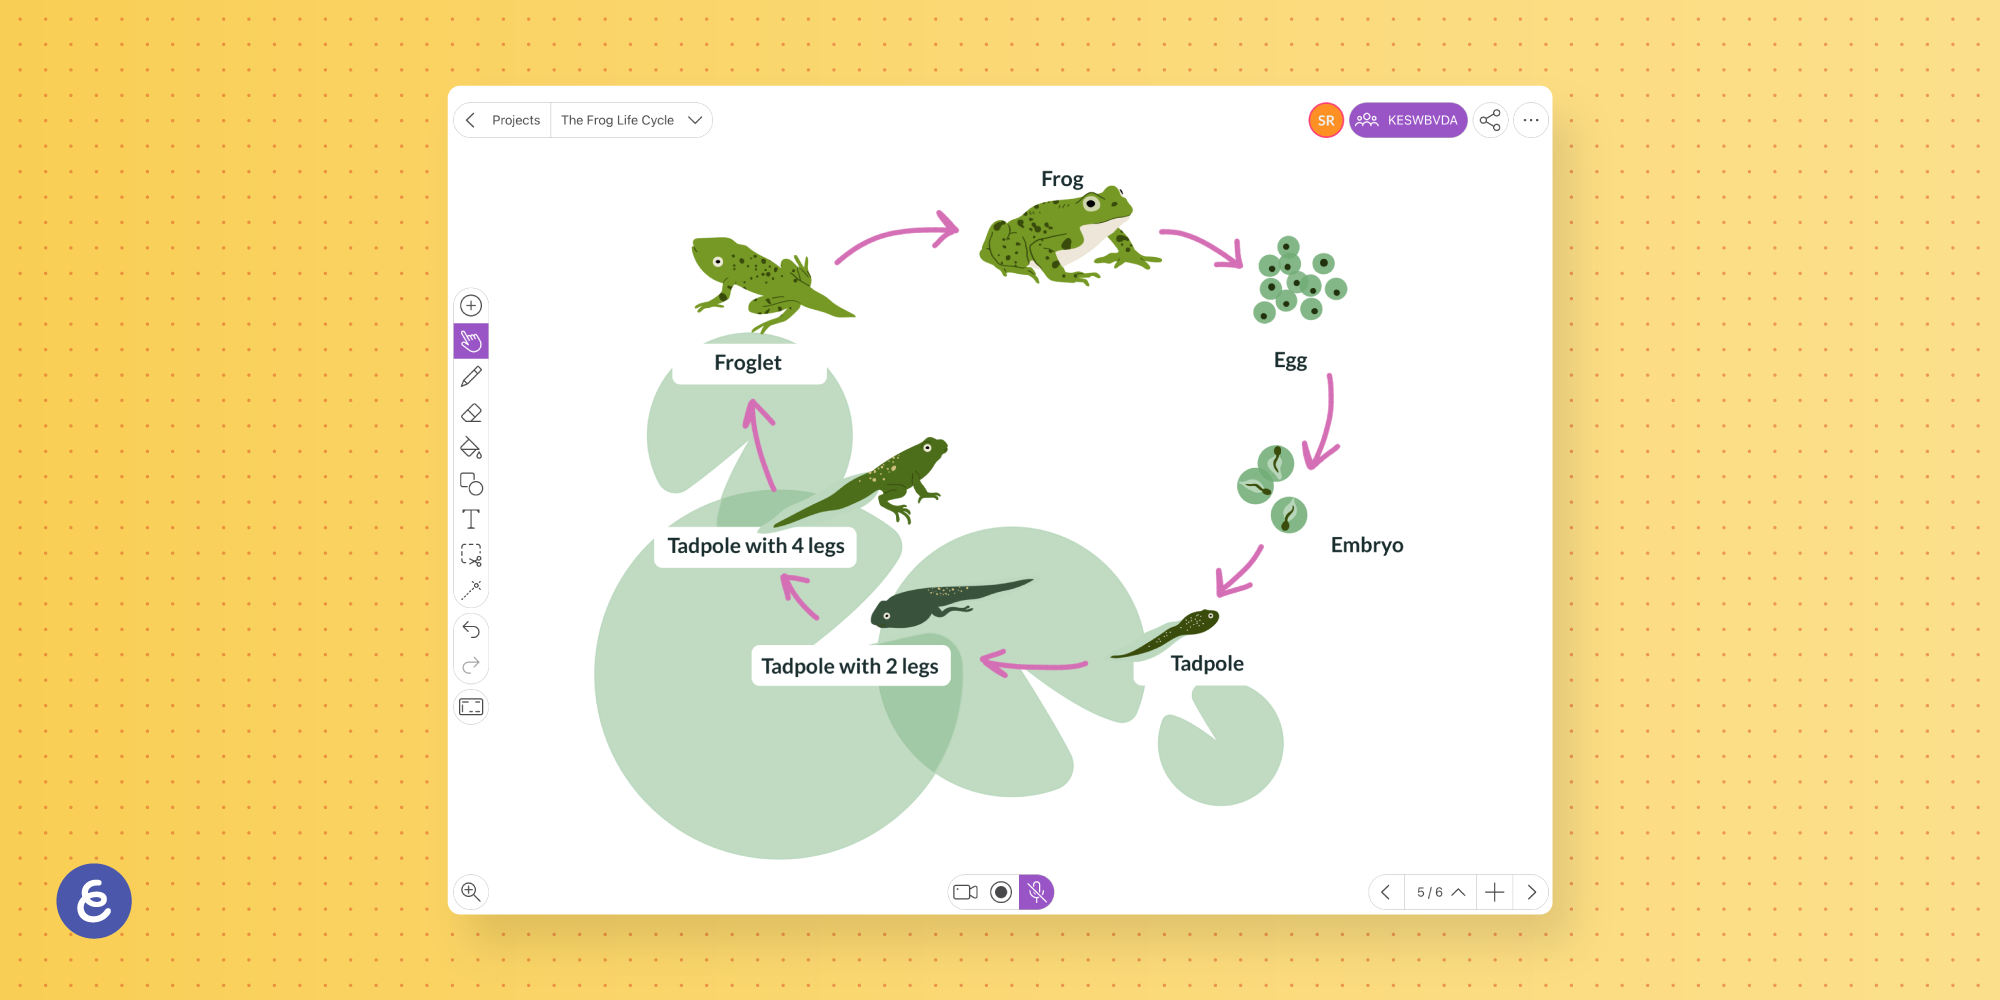
Cycle diagrams
A cycle diagram is similar to a flow chart in that it illustrates a sequence of events, but it must be circular. Often, the sections of this diagram are arrows that form a circle rather than separate sections joined together with lines (like a flow chart).
Teachers use cycle diagrams as a visual learning tool in their classrooms to show things like:
- The water cycle
- How to problem-solve
- Lesson and learning stages
How to make a cycle diagram using Explain Everything
You can quickly draw a cycle diagram in Explain Everything.
To do this:
- Log into your account or sign up for free
- Open up the whiteboard
- Create a New Project with a Blank Canvas
- Use the Draw Tool to create arrows, changing colors with each one
- Annotate using the Text Tool
Example cycle diagram

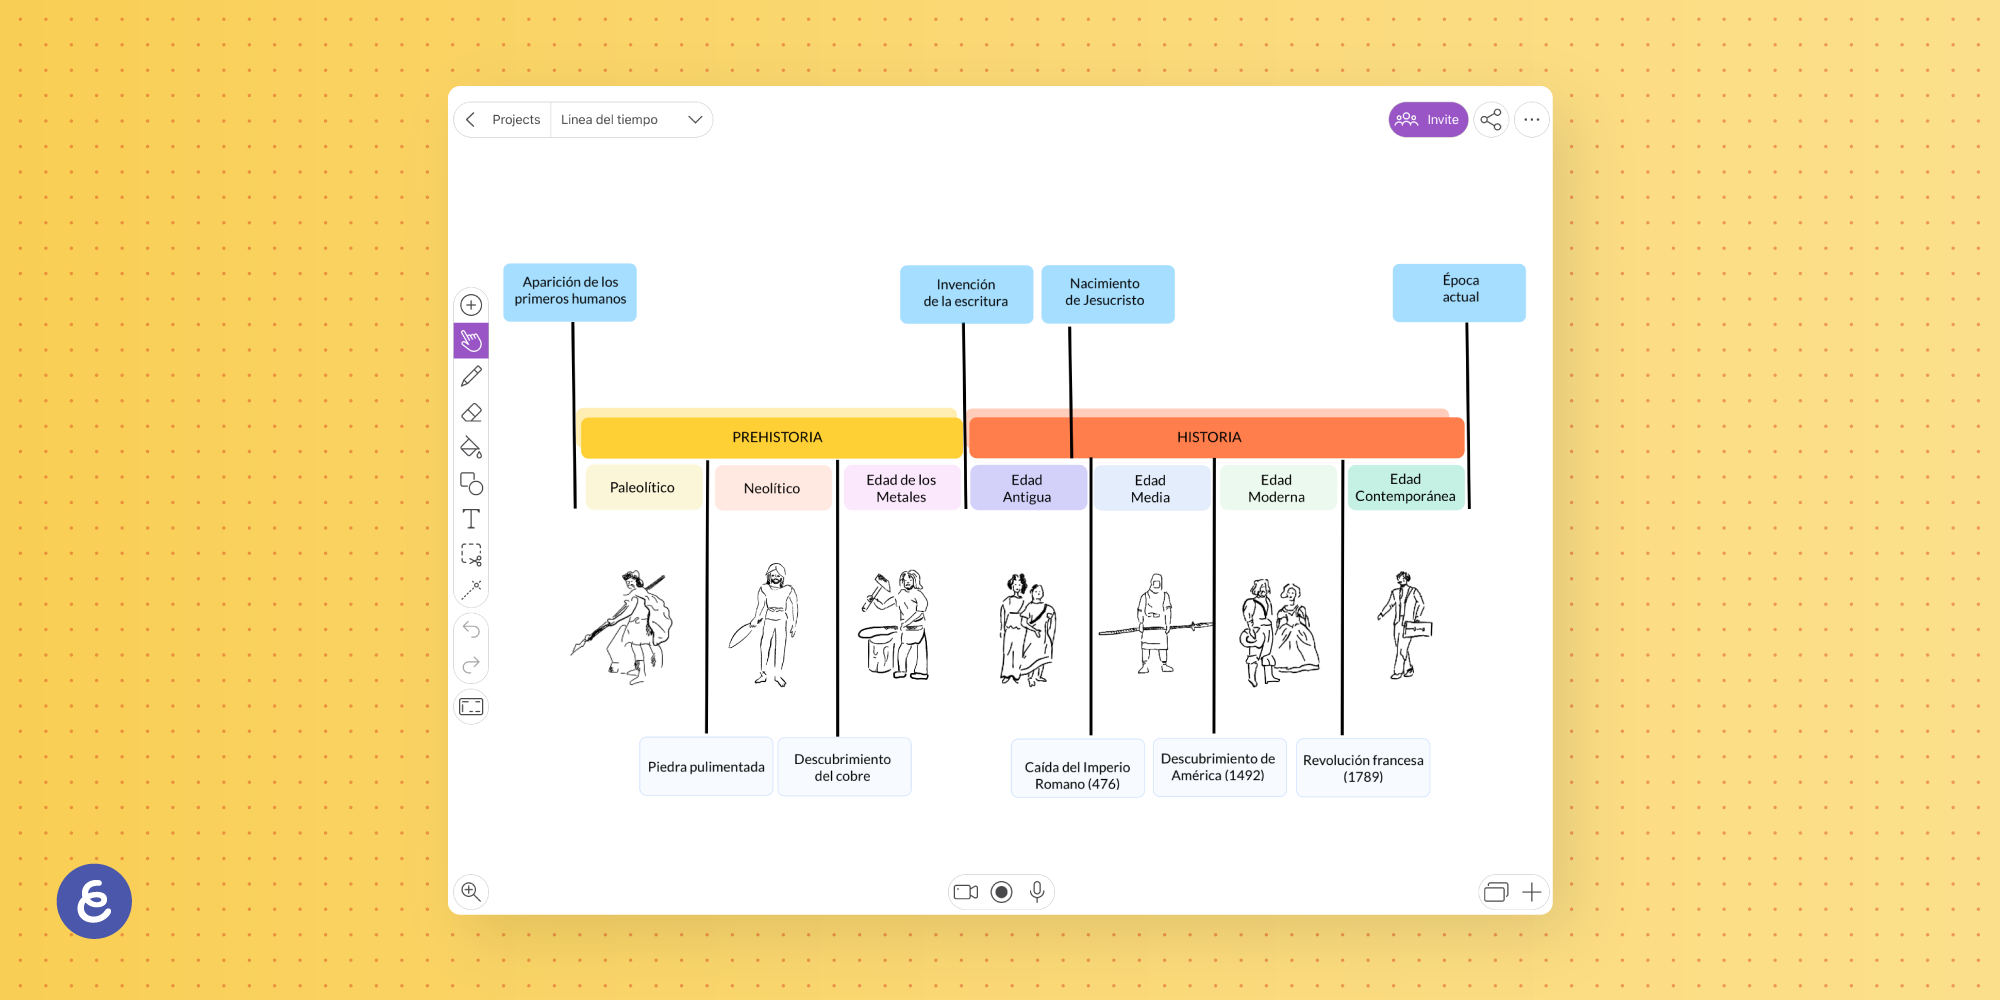
Timelines
A timeline is a visual representation of events in chronological order.
Teachers can use timelines for:
- History lessons — so that students get a visual view of what happened and when
- Mapping out plot points in a novel
- Asking students to complete their personal history, reflecting on milestones in their lives
To make timelines more interactive, educators can build the timeline and then ask pupils to arrange key moments in the correct order. With the help of using Explain Everything whiteboard software on an interactive display, pupils can drag and drop images and text along a timeline to match events with dates.
How to make a timeline using Explain Everything
To make a timeline in Explain Everything:
- Enter your account or start for free
- Click on the whiteboard
- Start a New Project with a Blank Canvas
- Click Add on the toolbar to insert Media
- Select Clipart
- Search ‘timeline’ and select the pre-made design (Need something different? Use the Draw tool to create your own lines, or use Shapes to draw a rectangle.)
- Annotate the timeline with dates using the Text Tool
- Insert more Media by pressing Add and importing visuals from Clipart, GIPHY, or Unsplash (via Image/GIF from the Web) or your own Existing Image/Video
- Add any additional written information with the Text Tool
Example timeline
Benefits of visual learning
Visual elements enhance students’ learning, engagement, understanding, and retention. There are various ways in which visuals help students learn. Some pupils will better recall information if they can mentally picture things they’ve previously seen. Others find that visuals help them concentrate. According to Gitnux Market Data, incorporating visual aids in the classroom can improve learning by up to 400%, making them a powerful tool in your lessons.
Some of the reasons visuals benefit learning is because they:
- Grab students’ attention — visuals catch the eye of distracted pupils and help them take in the associated information
- Help pupils activate or build on prior knowledge — using repeated imagery makes information stick; visual callbacks to previous lessons help students learn
- Minimize cognitive load — we can all only take on so much, and visuals give pupils a breather from too much reading; however, be careful as an overly busy visual screen is just as tiring to take in
- Make it possible to build new visual memories — this doesn’t just benefit those with photographic memories; the connection between visuals and other information makes it easier to remember the concepts discussed
While visual teaching has its benefits, some students will still prefer — and some will need — to learn in other ways. The best teaching methods are inclusive of diverse learning. Relying too heavily on visuals will unfairly disadvantage visually impaired pupils, while too much text makes things tricky for dyslexic students. Finding the right classroom management style and using a mix of learning materials and being sure to describe any visual materials to those who cannot see them will make for an inclusive and productive classroom environment. The best teachers help pupils learn in the ways that work for them.
Creating visual diagrams with Explain Everything
Explain Everything makes it easy for teachers to create visual teaching resources, including diagrams.
If you’re looking to build diagrams to use in your classroom, sign up for your free Explain Everything account today. Want to create unlimited custom templates and access additional features? Upgrade to Explain Everything Advanced.
Recommended articles:
- Online whiteboard for teaching, 5 ideas for getting started
- Teaching reading and writing with a smartboard
- How to make an ecomap with an online whiteboard